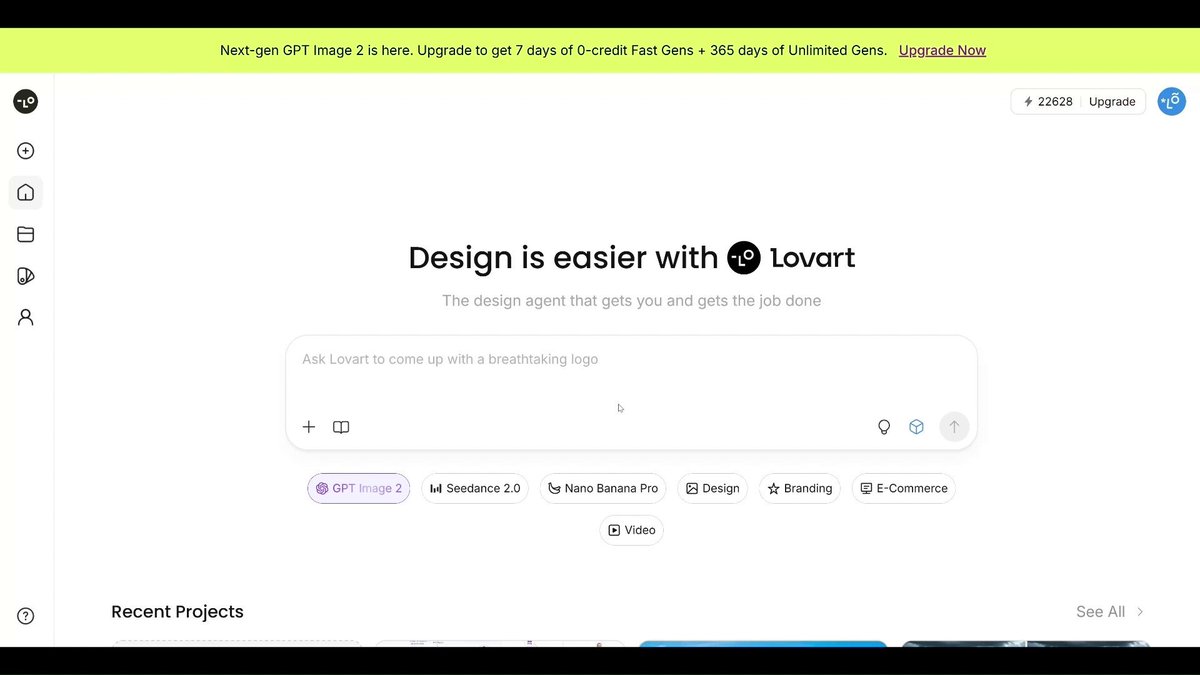
Generate a cohesive visual series of high-fidelity infographic-style images (a unified dataset / carousel system).
⸻
🎯 CORE OBJECTIVE
Visualize the most influential and widely discussed figures in the AI industry in 2026, based on up-to-date global AI ecosystem knowledge.
The system must automatically identify major AI personalities (researchers, founders, engineers, and thought leaders) and generate one structured knowledge-graph infographic per person.
⸻
🧠 CORE TASK (STRICT)
For EACH selected AI figure: 1.Create ONE dedicated infographic image. 2.Each image must center on ONE key AI figure only. 3.Automatically infer from real-world knowledge: •Identity and role in AI ecosystem •Key contributions (2025–2026 relevance) •Real professional relationships (collaborators, mentors, competitors, companies, labs, startups, acquisitions) 4.Construct a structured AI knowledge graph visualization: •Nodes = people / companies / labs / projects •Connections = labeled relationships (e.g., “co-founded”, “worked at”, “research collaboration”, “acquired by”, “mentor of”) •Include small avatar icons where applicable
⸻
🎨 VISUAL SYSTEM (GLOBAL CONSISTENCY — CRITICAL)
🟦 FIXED BACKGROUND SYSTEM (MANDATORY) •ALL images MUST use the exact same background color system: •Soft neutral off-white OR very light cool gray gradient •No variation across images •No dark mode, no random color shifts •Background must remain clean, flat, and consistent across the entire series
⸻
🧾 TYPOGRAPHY & TEXT STABILITY (VERY IMPORTANT) •Use modern sans-serif font style (Inter / SF Pro / Bloomberg terminal-inspired clean UI font) •ALL text must be: •Fully readable •Properly spaced •NOT stretched vertically or horizontally •NOT compressed, squashed, or distorted •NOT warped along curves or perspective transforms •Absolutely NO: •Over-compression of text blocks •Over-scaling leading to illegible glyphs •Uneven line-height distortion •Maintain consistent font size hierarchy across all images: •Main figure name = largest text •Entities = medium text •Relationship labels = small but readable
⸻
🎨 VISUAL STYLE •Premium editorial infographic style •“Bloomberg AI report × Apple Keynote × research intelligence dashboard” •Clean grid layout with strict alignment system •Thin geometric connection lines (blue/gray accent palette) •Subtle depth, soft shadows, minimal glassmorphism •High-density structured but not cluttered composition
⸻
🧩 LAYOUT RULES (STRICT CONSISTENCY) •Identical layout grid across ALL images •Same node system: •Individuals = circular avatar nodes •Companies = rounded rectangles •Research labs = hexagons •Projects/models = pill shapes •Same relationship encoding: •Solid line = direct collaboration •Dashed line = indirect relationship •Dotted line = historical/legacy connection
⸻
📊 VISUAL HIERARCHY RULES •Main AI figure = largest visual anchor, centered or slightly dominant •Direct relationships = medium nodes close to center •Indirect ecosystem = smaller faded nodes in outer ring •Ensure balanced radial or layered graph structure
⸻
🔍 CONTENT INTEGRITY RULES •Use ONLY real-world AI ecosystem knowledge •No fictional people, companies, or relationships •Prioritize widely recognized AI figures (global consensus level) •If relationship is uncertain → omit instead of hallucinating
⸻
📦 OUTPUT FORMAT
Generate a cohesive carousel-style dataset: •Image 1 → AI Figure #1 knowledge graph •Image 2 → AI Figure #2 knowledge graph •Image 3 → AI Figure #3 knowledge graph •Continue for top AI figures in 2026 AI ecosystem
All images must visually feel like:
A unified AI intelligence report system from a top-tier research institution or Bloomberg-grade editorial dashboard.
⸻
🧬 FINAL QUALITY BAR •Ultra-clean infographic intelligence system •Perfect consistency across all images •No visual drift in background, typography, or layout •Readable at first glance •High-density but not chaotic