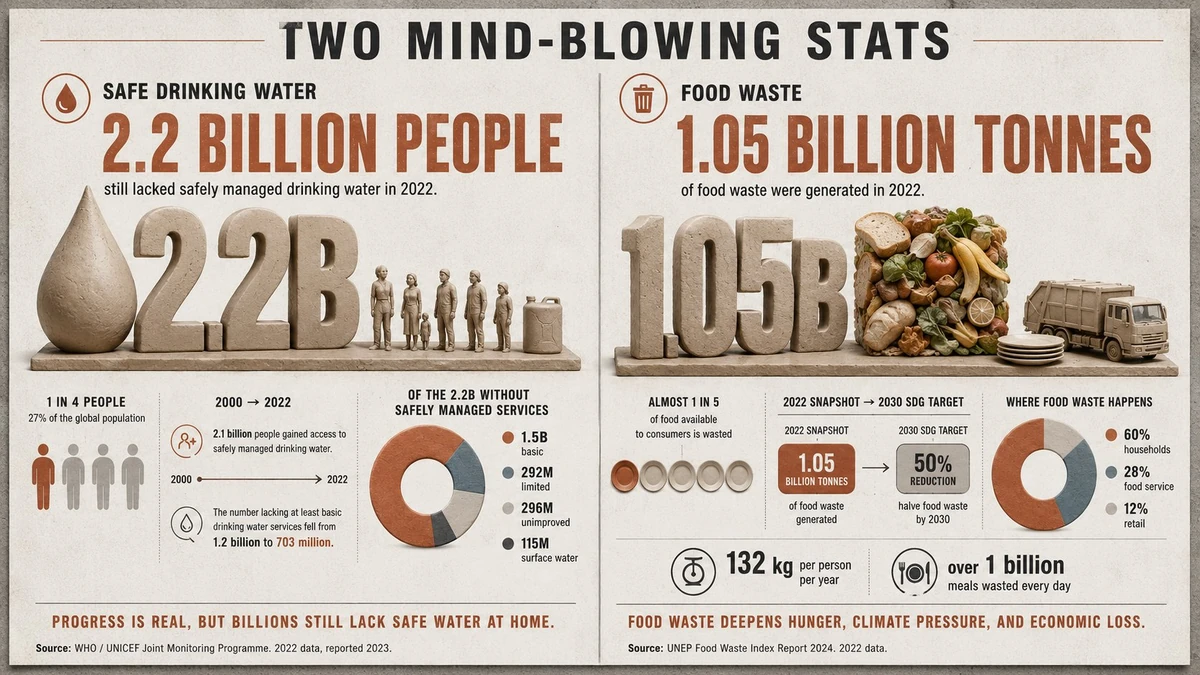
16:9, do this for 2 mindblowing stats, 2x1 grid => A designed editorial infographic poster in the spirit of beautifully-crafted data journalism, built on a clean modular grid with confident grotesque type hierarchy, turning [a rich statistic] into a composed page — one hero element at the center: the number physicalized as a single matte clay object beside a familiar reference for the gut-punch; then three smaller satellite visualizations arranged around it that break the headline down (a small unit-chart of individual icons, a thin timeline strip showing how it changed, a proportional ring or bar showing where it goes). A muted palette of concrete-grey, off-white, and a single accent color. Source year, footnotes, and a one-line takeaway set in small caps. The spirit: a museum wall panel or a spread from a gorgeous nonfiction book — one image that hits instantly, then keeps paying out the longer you read it.